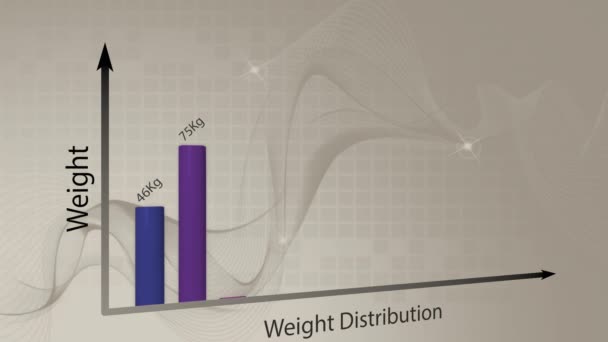
Bar graph forms data distribution as it summarizes generic performance. Designers can use almost any data message they choose. — stock vídeo, footage

Bar graph forms data distribution as it summarizes generic performance. Designers can use almost any data message they choose.

 — Vídeo de kelpfish
  • kelpfish
    Autorkelpfish
  • 634900836
  • Encontre vídeos similares
  • Duração: 00:20Proporção da imagem: 16:9

Mesma Série:

Plain horizontal infographic bar graph summarizes data performance in a generic fashion, allowing for placement of text or other design elements
Plain Horizontal Infographic Bar Graph Summarizes Data Performance Generic Fashion — Vídeo de Stock
An animated bar chart on alpha layer allows designers to place it over any background they wish.
Animated Bar Chart Alpha Layer Allows Designers Place Any Background — Vídeo de Stock
Plain horizontal infographic bar graph summarizes data performance in a generic fashion, allowing for placement of text or other design elements
Plain Horizontal Infographic Bar Graph Summarizes Data Performance Generic Fashion — Vídeo de Stock
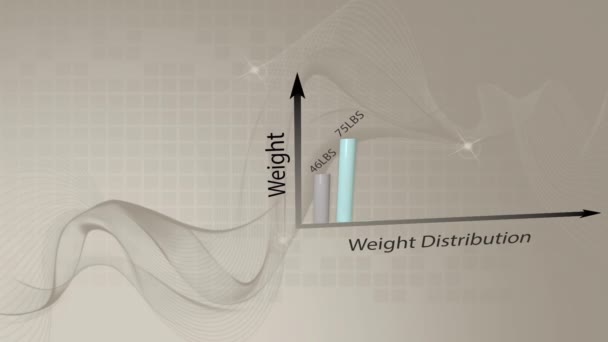
Bar graph forms results as it summarizes weight distribution
Bar Graph Forms Results Summarizes Weight Distribution — Vídeo de Stock
Bar graph forms results as it summarizes weight distribution
Bar Graph Forms Results Summarizes Weight Distribution — Vídeo de Stock
An animated pie chart slowly fills in with patterns of data and can be used for most financial and data related messaging. Room for placement of text or other elements.
Animated Pie Chart Slowly Fills Patterns Data Can Used Most — Vídeo de Stock
Line graph forms data distribution as it summarizes generic performance. Designers can use almost any data message they choose.
Line Graph Forms Data Distribution Summarizes Generic Performance Designers Can — Vídeo de Stock
Area graph forms data distribution as it summarizes generic performance. Designers can use almost any data message they choose.
Area Graph Forms Data Distribution Summarizes Generic Performance Designers Can — Vídeo de Stock
An animated pie chart slowly fills in with patterns of data and can be used for most financial and data related messaging. Room for placement of text or other elements.
Animated Pie Chart Slowly Fills Patterns Data Can Used Most — Vídeo de Stock
An animated Venn diagram slowly populates with the characteristics needed to create product demand.
Animated Venn Diagram Slowly Populates Characteristics Needed Create Product Demand — Vídeo de Stock
An animated pie chart slowly fills in with patterns of data and can be used for most financial and data related messaging. Room for placement of text or other elements.
Animated Pie Chart Slowly Fills Patterns Data Can Used Most — Vídeo de Stock
An animated ring chart slowly fills in with patterns of data and can be used for most financial and data related messaging. Room for placement of text or other elements.
Animated Ring Chart Slowly Fills Patterns Data Can Used Most — Vídeo de Stock
Um braço de robô de alta tecnologia 3D se movendo em várias posições posicionadas contra um fundo de grade.
Braço Robô Alta Tecnologia Movendo Várias Posições Posicionadas Contra Fundo — Vídeo de Stock

Informações de uso

Você pode usar este vídeo "Bar graph forms data distribution as it summarizes generic performance. Designers can use almost any data message they choose." sem royalties para fins pessoais e comerciais de acordo com a Licença Padrão. A Licença Padrão abrange a maioria dos casos de uso, incluindo anúncios e designs de interface do usuário em sites e aplicativos.

Você pode comprar esta filmagem e baixá-la em alta resolução até 1920x1080.